In the era of big data, businesses are inundated with vast amounts of information. Yet, simply having data isn’t enough. It’s the ability to extract meaningful insights and turn them into actionable intelligence that sets successful enterprises apart.
This is where data visualization plays a pivotal role. By presenting complex data in visual formats like charts, graphs, and maps, businesses can uncover patterns, trends, and relationships that might otherwise remain hidden.
In this article, we will explore how businesses harness the power of visualization to transform raw data into actionable intelligence.
Understanding the Importance of Data Visualization
Data visualization serves as a bridge between raw data and actionable insights. By transforming complex datasets into visual representations, businesses can enhance comprehension and decision-making across all levels of the organization.
According to GeeksforGeeks, numerical and categorical data are the two primary types of data. Both types of data are essential for comprehensive analysis. Visualizing them accurately enables researchers to glean valuable insights and make informed decisions.
Whether it’s sales figures, market trends, or operational metrics, visualization techniques offer a clearer understanding of the underlying patterns and relationships within the data. Moreover, visualizations facilitate communication by presenting information in a format that is easily digestible and accessible to stakeholders with varying levels of technical expertise.
This clarity and accessibility are essential for driving alignment and consensus within the organization, fostering a data-driven culture where informed decisions are the norm.
Extracting Insights from Customer Data
Customer data is a treasure trove of valuable insights that can drive business growth. Through data visualization, businesses can analyze customer demographics, purchasing behavior, and engagement metrics to gain a deeper understanding of their target audience.
Visualizations such as customer journey maps and cohort analyses enable businesses to identify trends, preferences, and pain points along the customer lifecycle. Armed with these insights, organizations can personalize marketing campaigns, optimize product offerings, and deliver exceptional customer experiences that resonate with their audience.
Leveraging customer data through visualization empowers businesses to build stronger relationships, drive loyalty, and stay ahead of evolving market dynamics.
Enhancing Decision-Making Processes
In today’s fast-paced business environment, timely and informed decision-making is crucial for success. Data visualization plays a pivotal role in enhancing decision-making processes by providing decision-makers with actionable insights in real time.
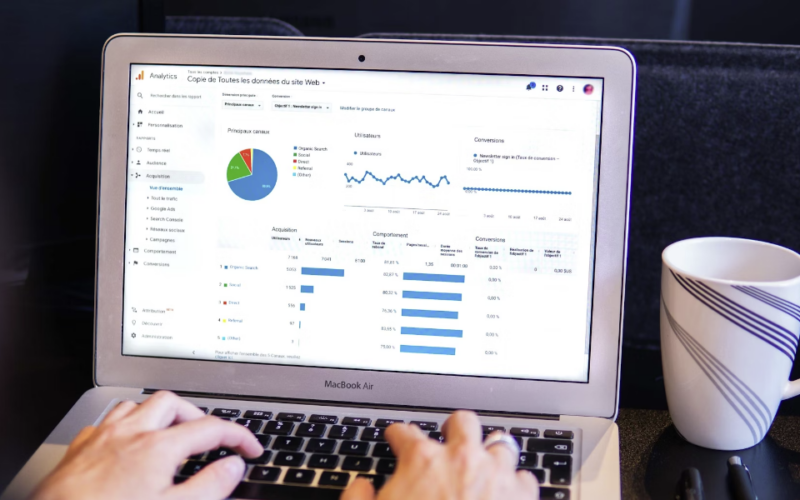
Visualizations such as dashboards and interactive reports enable stakeholders to quickly identify trends, outliers, and opportunities, allowing for agile responses to changing market conditions.
Visualization fosters collaboration by enabling stakeholders to explore data together, share insights, and align on strategic priorities. By leveraging visualization tools, businesses can streamline decision-making processes, mitigate risks, and capitalize on emerging opportunities more effectively.
Optimizing Operational Efficiency
Operational efficiency is a cornerstone of business success, and data visualization offers valuable tools for optimizing processes and workflows. By visualizing operational data such as production outputs, supply chain logistics, and resource utilization, businesses can identify bottlenecks, streamline workflows, and improve resource allocation.
Visualizations such as process maps and flowcharts provide a clear overview of complex processes, enabling stakeholders to identify inefficiencies and implement targeted improvements. Furthermore, real-time dashboards allow operations managers to monitor key performance indicators (KPIs) and track progress toward operational goals, facilitating proactive decision-making and improvement.
Improving Marketing Strategies
Statista reports that as of January 2024, there are approximately 5.35 billion active internet users worldwide. Undoubtedly, the Internet is a valuable resource that can significantly expand your business’s reach to a global audience.
One of its greatest advantages is its accessibility and the limitless opportunities it offers for digital engagement. Leveraging various online distribution channels for marketing allows you to effectively communicate with your target audience and encourage their active participation.
Effective marketing strategies are built on a deep understanding of consumer behavior and market trends. Data visualization empowers marketers to gain actionable insights from market data, consumer surveys, and campaign analytics.
Visualizations such as customer segmentation charts and heatmaps of website engagement enable marketers to identify audience segments, track campaign performance, and optimize marketing spend. By visualizing marketing data, businesses can identify emerging trends, capitalize on market opportunities, and tailor their messaging to resonate with their target audience.
Additionally, visualization facilitates cross-functional collaboration between marketing, sales, and product teams, ensuring alignment on strategic objectives and maximizing the impact of marketing initiatives.
Acquiring Strategic Insights with Account Mapping Tools
Account mapping tools provide businesses with visual representations of their customer relationships and interactions. These tools enable organizations to map out account landscapes, identify key stakeholders, and uncover strategic opportunities for growth.
By visualizing customer data in this manner, businesses can gain insights into the hierarchy of decision-makers and understand the dynamics of complex buying processes. This enables them to prioritize strategic accounts for targeted sales and marketing efforts.
Prolifiq notes that account mapping tools facilitate cross-functional collaboration by providing a centralized platform for sharing account information and aligning on account-specific strategies. With account mapping, businesses can unlock strategic insights that drive revenue growth, enhance customer relationships, and gain a competitive edge in the marketplace.
Driving Innovation and Growth
Data visualization fuels innovation by providing businesses with new ways to explore and understand their data. Visualizations such as trend analysis charts, predictive models, and interactive data visualizations enable organizations to uncover patterns, identify outliers, and generate actionable insights.
By visualizing data in innovative ways, businesses can identify emerging market trends, anticipate customer needs, and develop products and services that meet consumer demands.
Interpolation is one such innovative component of data visualization. As per Investopedia, it’s a statistical technique where known values are utilized to predict unknown ones. In the world of investing, interpolation aids in estimating security prices or potential yields. This method relies on established values positioned sequentially to derive the unknown value.
Overall, visualization fosters a culture of experimentation and continuous improvement. It provides stakeholders with a platform to test hypotheses, iterate on ideas, and measure the impact of strategic initiatives.
FAQs
What is the application of data visualization in business?
Data visualization in business aids in understanding trends, patterns, and relationships within data sets, facilitating informed decision-making. It enhances communication, drives insights, and supports strategic planning across various functions such as sales analysis, market trends, performance tracking, and risk management.
What insights can data give a business?
Data can provide businesses with insights into customer behavior, market trends, operational efficiency, and financial performance. These insights enable informed decision-making, targeted marketing strategies, process optimization, and identification of growth opportunities, ultimately driving competitive advantage and profitability.
What is partner account mapping?
Partner account mapping involves identifying key stakeholders within partner organizations and understanding their roles, relationships, and objectives. This process helps establish strategic alignment, foster collaboration, and drive mutual value creation between partnering entities in various business initiatives and engagements.
In conclusion, data visualization stands as a cornerstone in the modern business landscape, offering a pathway from raw data to actionable insights. Its transformative power extends across various domains, enabling businesses to uncover patterns, optimize operations, and refine strategies in response to dynamic market forces.
Beyond mere visualization, it fosters collaboration, innovation, and a culture of data-driven decision-making. As organizations strive for competitive advantage and sustainable growth, embracing visualization isn’t just prudent—it’s essential.
In the age of big data, those who harness the full potential of visualization will not only survive but thrive.


